

Financial Template Store
Beta calculation excel template - all 3 methods
Beta calculation excel template - all 3 methods
Det gick inte att ladda hämtningstillgänglighet
What is Beta (β)?
The Beta (β or beta coefficient) of a stock (or portfolio) is a measure of the (average) volatility (i.e. systematic risk) of its returns relative to the (average) volatility of the overall market returns (e.g. a benchmark index such as the S&P 500). β is used as a proxy for the systematic risk of a stock, and it can be used to measure how risky a stock is relative to the market risk. The β value of a stock can have the following interpretation:
- β =1 indicates that the price activity of a stock is strongly correlated with the market (i.e. as volatile/risky as the market)
- β >1 indicates that the price activity of a stock is more volatile than the market. Its price will tend to move (rise & decline) with more momentum than the benchmark. Including this stock in a portfolio makes it more risky than the same portfolio without the stock. With a β of 2, one would expect the price of the stock to rise (or decline) twice as fast compared to the broader market, on average.
- β <1>0 indicates that the price activity of a stock is less volatile than the market. Its price will tend to move (rise & decline) with less momentum than the benchmark. Including this stock in a portfolio makes it less risky than the same portfolio without the stock.
- β =0 indicates that the price activity of a stock is uncorrelated to the market
- β <0 indicates that the price activity of a stock is negatively correlated to the market
Calculate Beta (β) in Excel - All 3 Methods (Regression, Slope & Variance/Covariance)
You can use either of the three methods to calculate Beta (β) in excel, you will arrive to the same answer independent of the method. You can download my Excel file with all calculations and source data at the bottom of this page.
Step 1 - Download historical stock prices and index data
- First, you need to download historical stock prices and index data for the latest three or five years (on a daily or monthly basis) from a website of your choice (e.g. Yahoo! Finance, Seeking Alpha or Google Finance).
- Throughout this project I have used stock data (Apple - AAPL) and index data (S&P 500 - GSPC) for the five-year period 2017-10-28 - 2022-10-28 from Yahoo! Finance.
- As mentioned, you can calculate Beta based on both monthly and daily data. I have done both, please refer to the attached file for calculations and source data.
Once you have downloaded the data for both the stock and the index, make the following for each data set:
- Sort column "Date" from Oldest to Newest
- Column "Adj Close" is the only column we need (except from column "Date" of course).

Step 2 - Merge the stock and index data into a single table with a single "Date" column

Step 3 - Calculate the daily/monthly return for both stock and index
You can use which return structure you like, e.g. logarithmic returns or "simple" returns. I have done both, please refer to the attached file for calculations and source data.


If you are not familiar with time series modeling, one would consider consider using logarithmic returns when doing time series modeling. Among other things due to that simple returns are not symmetric and are not additive over time. With other word, simple returns are not symmetric as positive and negative percentage returns of equal size do not cancel each other out. In addition, the sum of simple returns over multiple periods does not equal the total return across all sub-periods (from first to last period). Logarithmic returns, on the other hand, are symmetric and additive over time. For example, to summarize and calculate arithmetic mean makes sense when working with logarithmic returns. Please see the picture below for some examples.

Step 4 - Calculate Beta - All 3 Methods (Regression, Slope & Variance/Covariance)
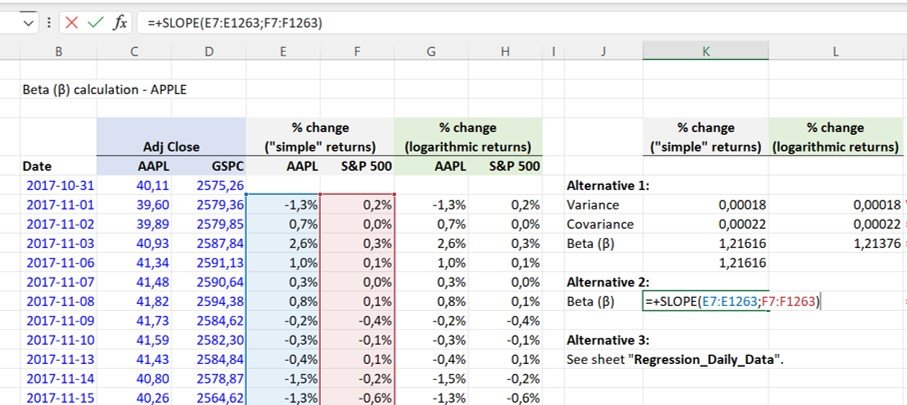
Method 1 - Variance/Covariance
- Calculate the Variance of the benchmark using Excel's VAR.P function

- Calculate the Covariance between the stock price returns and the benchmark price returns using Excel's COVARIANCE.P function. Make sure you select the stock price returns as array1 in the function.

- Divide the Covariance by the Variance to calculate Beta. You could of course merge the two functions into a combined formula like this: =COVARIANCE.P(E7:E1263;F7:F1263)/VAR.P(F7:F1263)

Method 2 - SLOPE function
- Calculate the slope (Beta) of the linear regression line through data points (price returns) for the stock and the benchmark index. The slope is the vertical distance divided by the horizontal distance between any two points on the line, which is the rate of change along the regression line. This can easily be done leveraging Excel's SLOPE function. Make sure you select the stock price returns as known_y's in the function.

Method 3 - Data regression
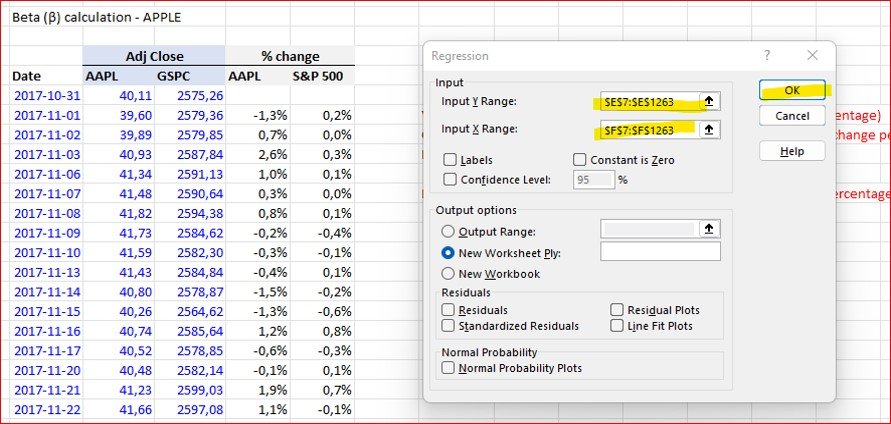
In the third method we leverage Excel's Regression calculator, which is part of the add-in Analysis ToolPak. You find the Regression calculator under the Data Analysis button on the Data tab. If you cannot find the Data Analysis button, you need to activate the Analysis ToolPak add-in (see pictures below for reference).


- Make sure you select the stock price returns as "Input Y Range" in the Regression pop-up window (as shown below)

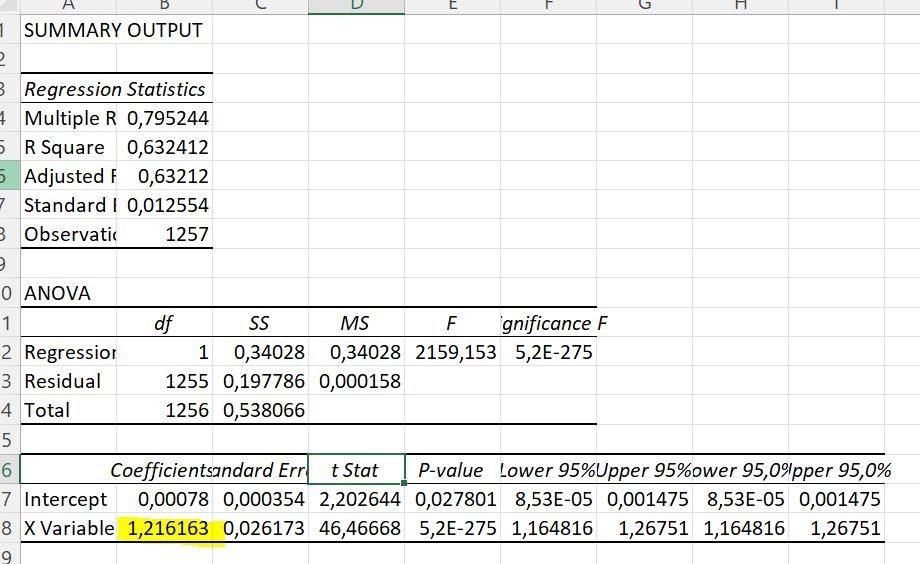
- You find the Beta value in the Coefficients column in the Summary Output sheet

Levered vs. Unlevered Beta
Levered beta (or equity beta) is the beta of a company inclusive of the effects from the capital structure. The beta that we calculated above is the Levered Beta.
Generally, a higher debt-to-equity ratio should cause the risk associated with a company’s equity shares to increase (all else being equal). The more debt a company has (and the higher the debt-to-equity ratio), the higher the risk of default (all else being equal).
Levered Beta = Unlevered Beta * [1 + (1 – Tax Rate) * (Debt / Equity)]
Unlevered beta, on the other hand, removes the effects from financial leverage to isolate the risk related to a company’s assets (i.e. pure business risk without any financial risk). For that reason, unlevered beta is often called “asset beta” because it measures the expected volatility of the underlying asset as if the company is completely financed by equity.
The levered beta of a firm is different than the unlevered beta as it changes in positive correlation with the share of debt of a company's capital structure. Typically, a company’s unlevered beta can be calculated by taking the company’s reported levered beta from a financial database such as Bloomberg, Yahoo! Finance, Seeking Alpha or Google Finance and then applying the following formula:
Unlevered Beta = Levered Beta / [1 + (1 – Tax Rate) * (Debt / Equity)]